Definitions and Data
Defining the Suburbs
Accurately conceptualizing space is theoretically and empirically problematic (Fowler and Jensen 2020). Without a uniform definition of suburbia, quantitative research in the social sciences has relied on indirect census definitions, balancing bounded units of metropolitan and micropolitan statistical areas, and by examining metrics such as the distance from the nearby city center or population density (T. J. Cooke and Denton 2015).
With this in mind, this research focuses on mechanisms which are consistent across the suburban literature. Three definitions are included based on characteristics of age, distance, and administrative delineations and they are inspired by how others have focused the suburban in their research (see Figure 1).1
1 To note, all of these definitions include similarities and differences. While the reliance on the MSA and the CDP means that all definitions situate a similar spatial territory, each definition centers a different characteristic (age, distance, general categorization). It may be that all definitions both capture and overlook some suburban processes, but this work offers a useful starting point in the critical need to build more empirical rigor when studying the suburban.
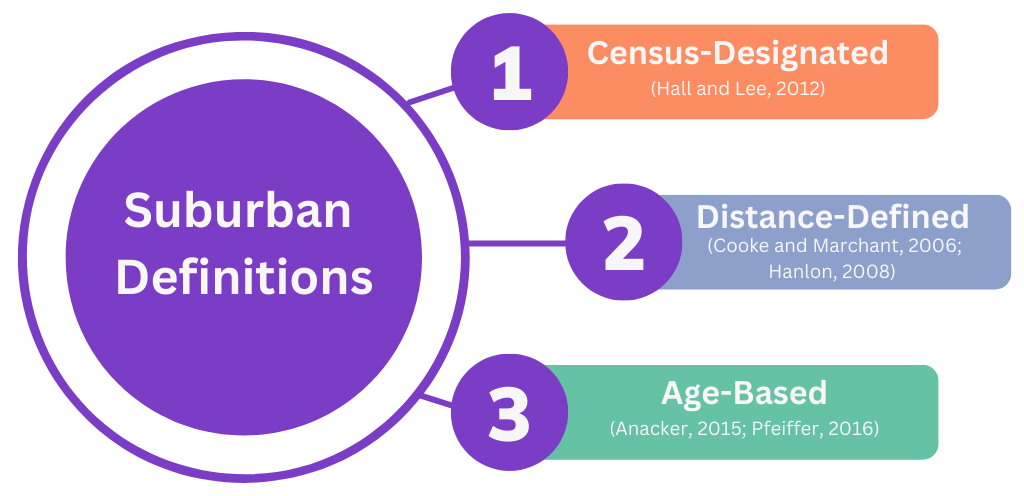
To explain the definitions further, the Census-Designated Suburb disagregate the Metropolitan Statistical Area from the Census Designate Place and defines the remaining tracts as suburban (Hall and Lee 2010). This essentially involves removing the inner core from the city. The Distance-Defined Suburb further devolve the landscape into an inner suburban and outer suburban bounded space. This categorizes the tract intersecting with the Census Designated Place as a inner suburb, those tracts beyond this border as outer suburban, and it retains all tracts that intersect with the MSA rather than ending with the border (T. Cooke and Marchant 2006; Hanlon 2008). The Age-Based Suburb remove the Census Designate Place and then categorize the remaining tracts based on the age of housing development. Within this, Post-Civil Right Suburbs had 75% or more of their housing stock built after 1969, while Pre-Civil Right/Older Suburbs situate as the remaining tracts following these dissagragations as they are not the central city and they have less than 75% of their housing stock built following 1969 (Anacker 2015; Pfeiffer 2016).
Data and Approach
Two five-year American Community Survey datasets (2007-2011 and 2017-2021) are used to build an exploratory data analysis of how these suburban spaces have changed demographically (see Table 1). For further clarity, ACS data retrieval is achieved using the TidyCensus package (Walker 2022), along with census tract geometries, and all data wrangling and exploratory analysis is performed within RStudio. The exploratory data analysis maps how the spatial setting has changed, and how demographic and economic characteristics have shifted between 2011 and 2021 for the cities of Charlotte, Pittsburgh, and Portland.
| Dataset | Code | Description |
|---|---|---|
| Year Structure Built | B25034 | The year of household construction aggregated to a decennial grouping. Used for the Pre/Post-Civil Right Suburb definition. |
| Total Population | B01003 | Includes the total population of each census tract. |
| Hispanic or Latino Origin by Race | B03002 | Includes the classification of major and minority groups, and those of two or more races broken down by Hispanic and non-Hispanic. |
| Nativity in the USA | B05012 | Details the total population, the native population, and foreign-born population. |
| Median Household Income | B19019 | Median household income by size. |