Pittsburgh
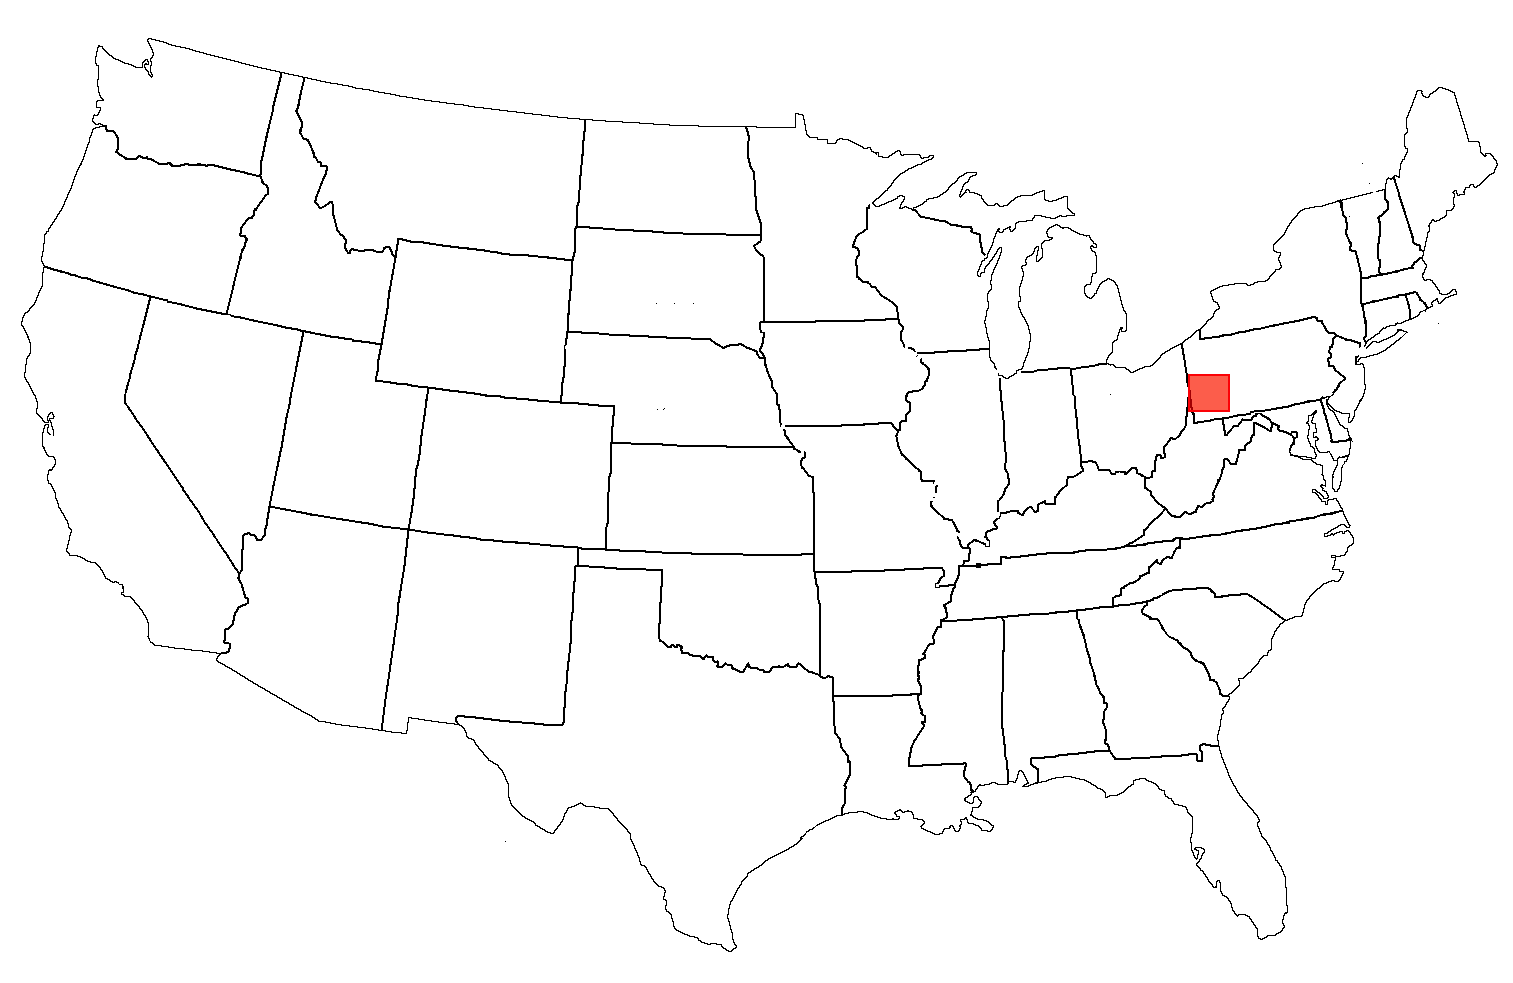
The second location of study includes Pittsburgh, PA. Pittsburgh forwards a hugely different social and economic context in the late-twentieth and early-twenty first centruy in comparison with Charlotte or Portland, and it witnesses a much smaller population change. The suburban definitions are illustrated first, followed by the relevant demographic variables.
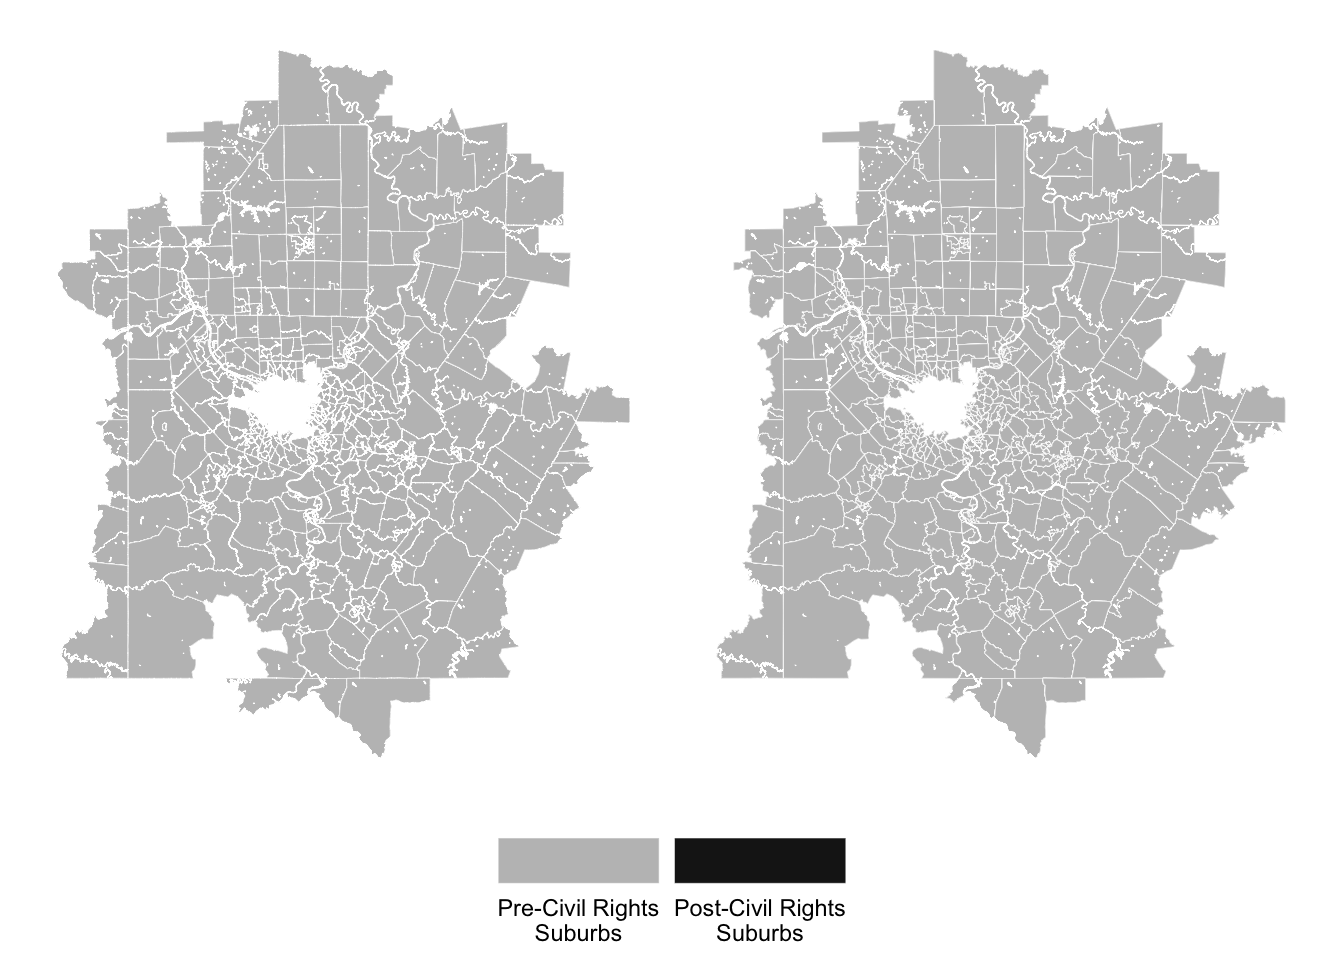
Pittsburgh and its suburbs
Census-Designated Suburbs
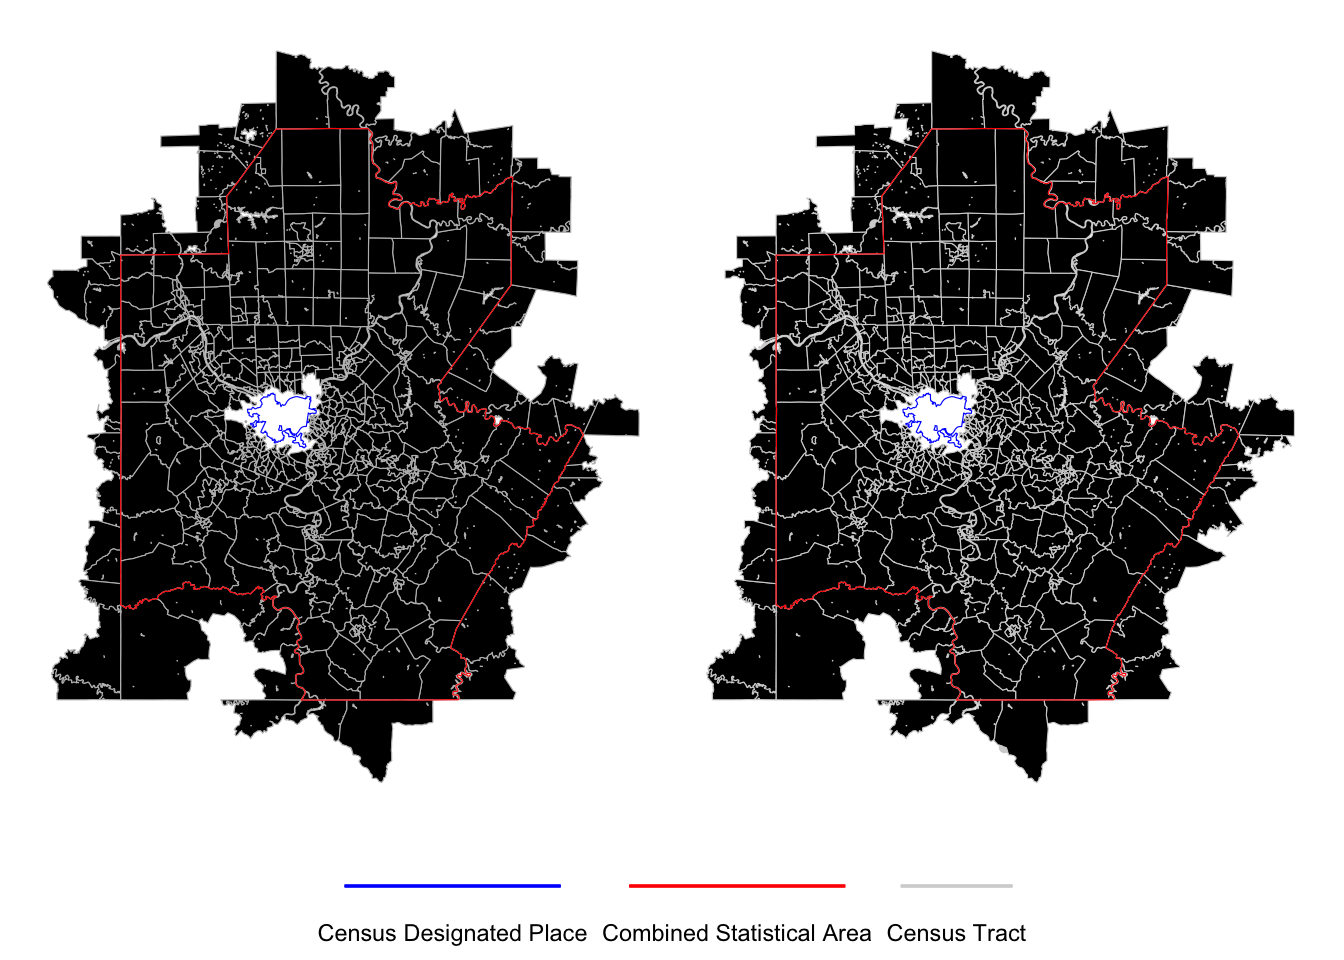
Distance-Defined Suburbs
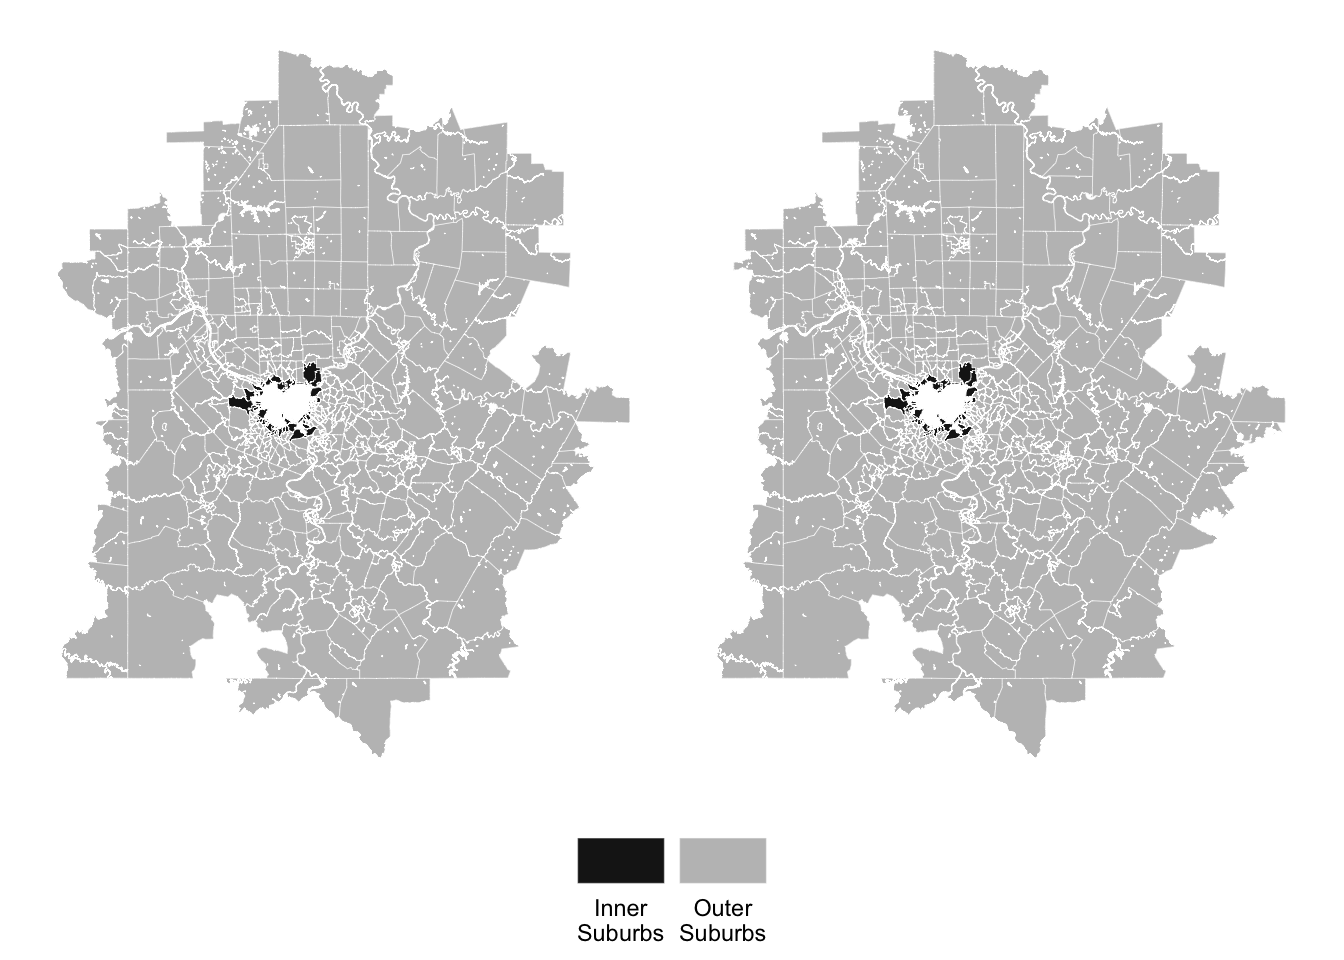
Age-Based Suburbs
Changes in Population
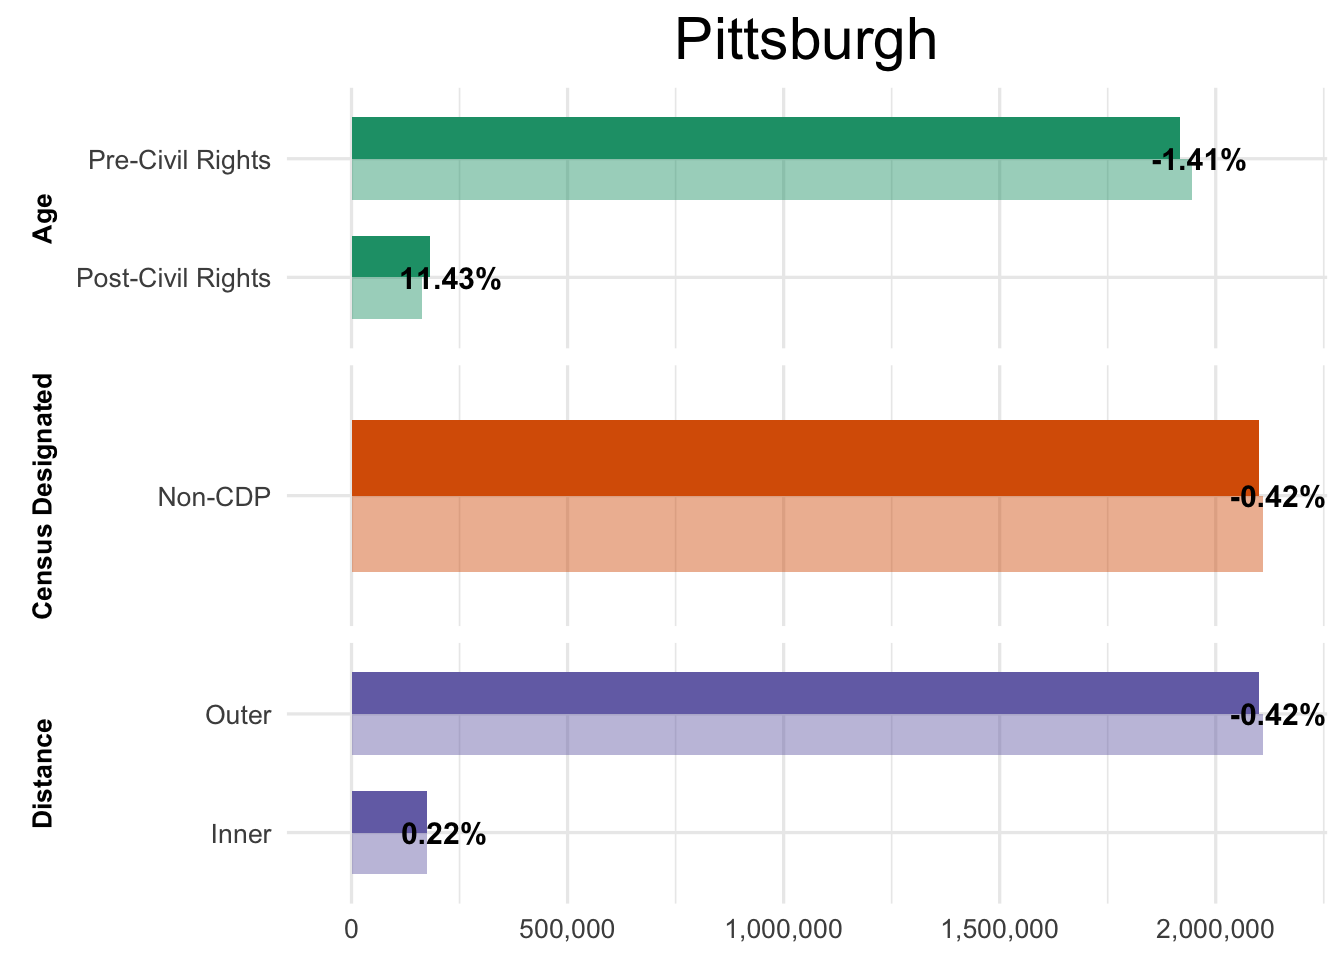
Total Population
The aggregated total population of each suburban form is shown below. Figure 4 below illustrates the population total in 2011 with the total in 2021 included above. Interestingly, Pittsburgh doesn’t forward the huge population increases like Charlotte but rather it shows a general decrease across its wider suburban space.
Changes across race/ethnicity
Table 1 moves into the specific population change for each ethnoracial group. The percentage change in the total population of the major racial groups is included for each setting. Pittsburgh shows the largest decrease in the non-Hispanic White Population across many of its suburban settings, with the only other decreased seen in the non-Hispanic Black population in the Inner Suburbs. Hispanic, Asian, and Small Grouped individuals show large increases in there suburban residence.
| Suburban | Type | NH-White | NH-Black | Hispanic | Asian | Small Group |
|---|---|---|---|---|---|---|
| Age | Pre-CR | -5.30 | 5.75 | 42.72 | 45.46 | 27.84 |
| Post-CR | 14.17 | 75.86 | 124.24 | 66.07 | 362.86 | |
| Census Designated | Non-CDP | -3.60 | 7.73 | 50.33 | 49.03 | 40.89 |
| Distance | Inner | -4.41 | -3.39 | 88.88 | 48.18 | 103.21 |
| Outer | -3.60 | 7.73 | 50.33 | 49.03 | 40.89 |
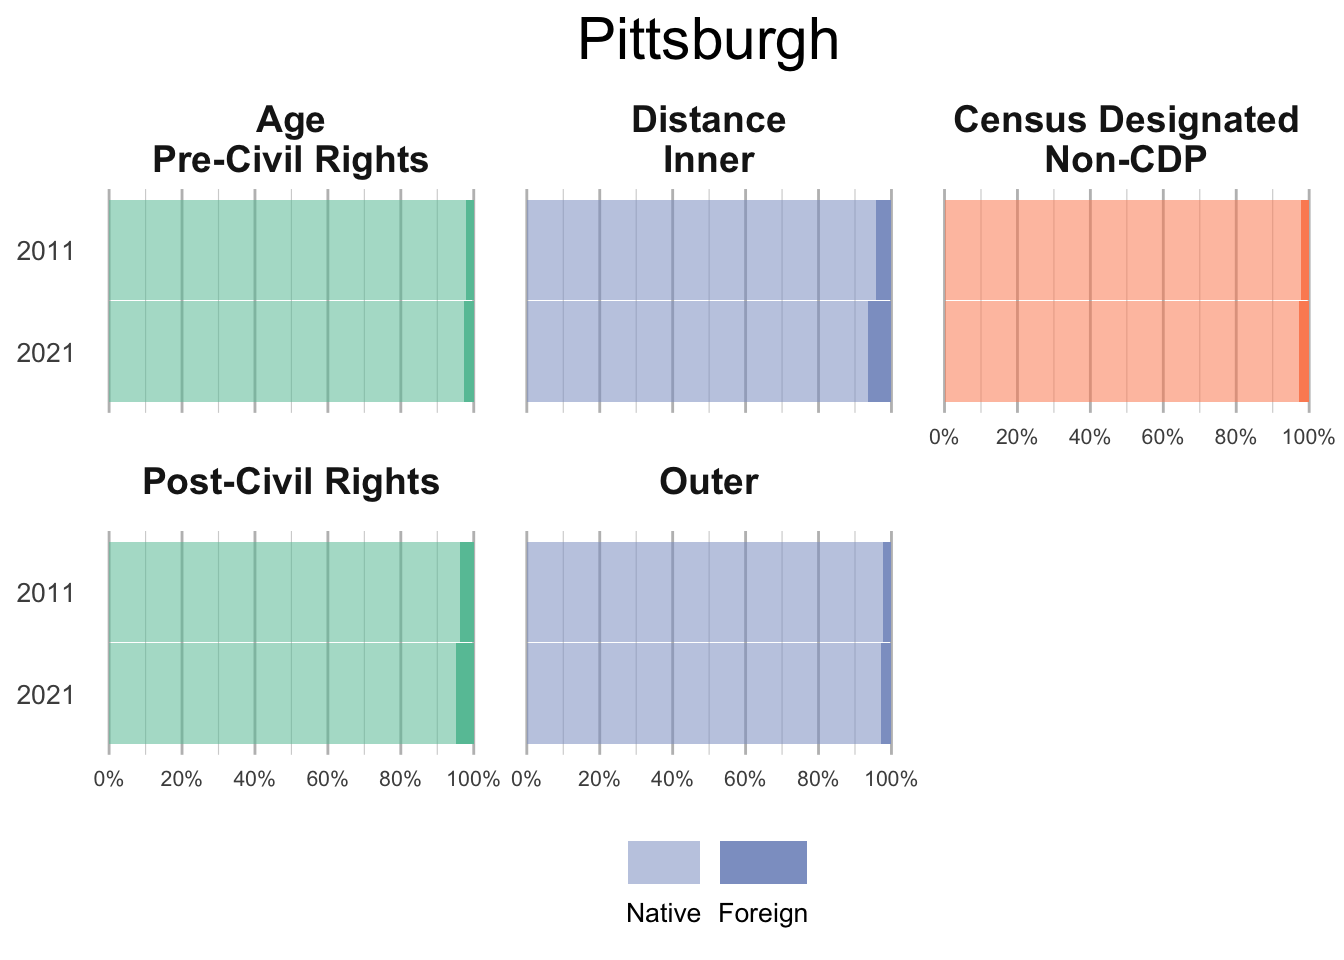
Native and Foreign Born
Below describes the proportion of native and foriegn born populations across each suburban setting in Pittsburgh. Data for 2011 are positioned above 2021 in each chart to illustrate the change. Again, the foreign-born population increases across all definitions of Pittsburgh.
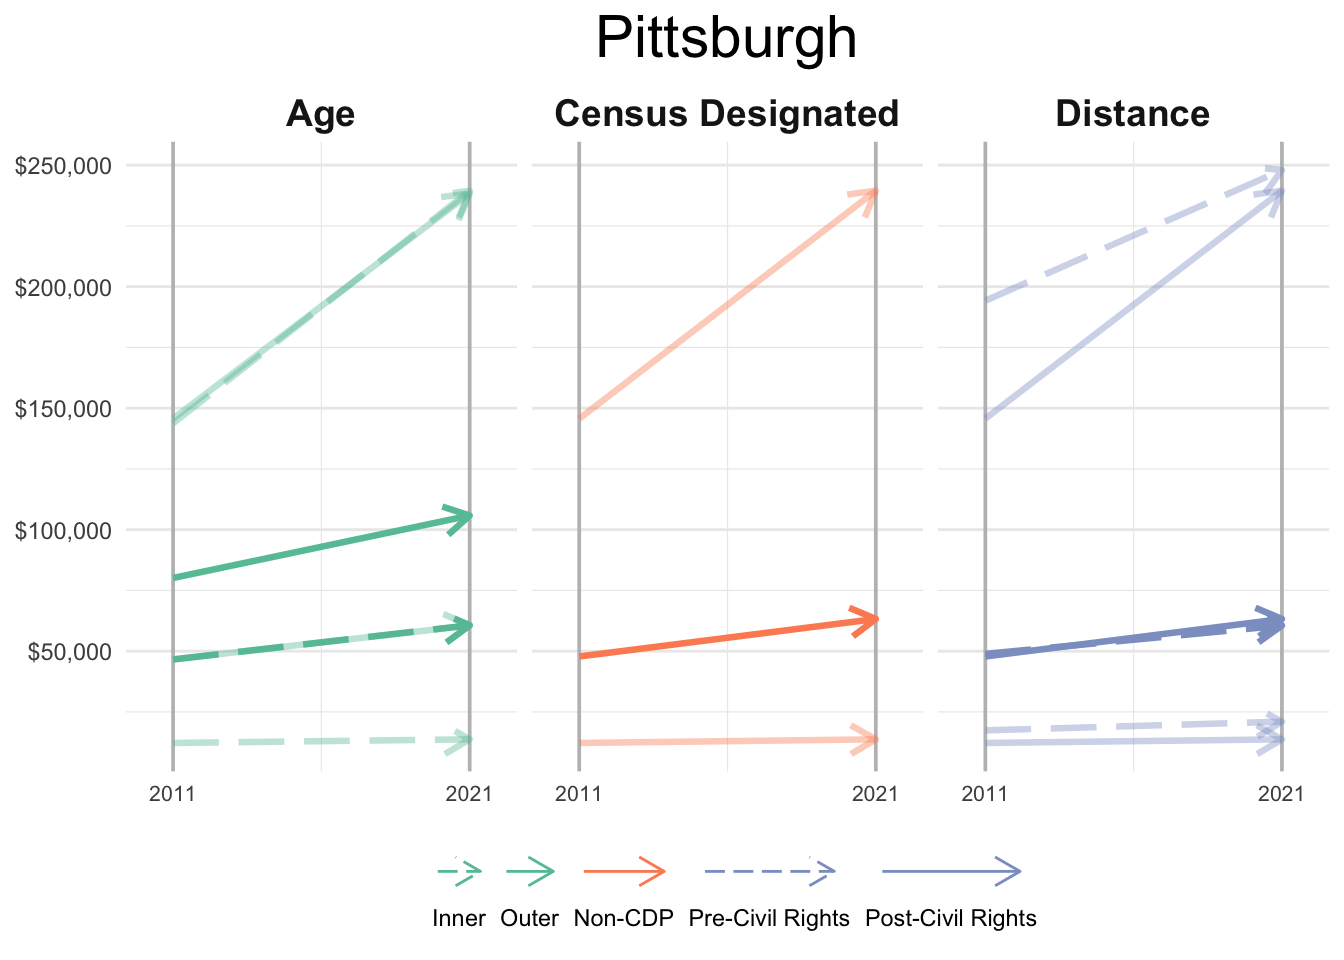
Median Household Income
The final projection shows illustrates how the household income at tract level has changed throughout the ten-year period. Figure 6 shows the tract with the lowest and highest median household income in Pittsburgh, and also the median value too. Strikingly, the lowest tract income barely changed across the ten years in Pittsburgh, especially in the Inner Suburbs and Pre-Civil Rights Suburbs, while the tract with the highest median income increased by around $100,000.